
|
 The nuclear
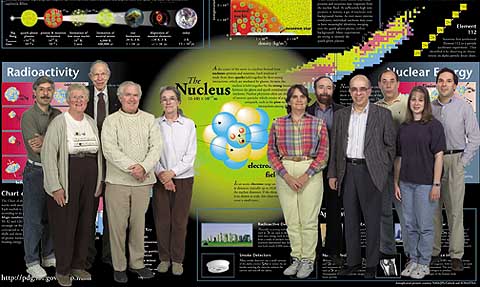
science wall chart, conceived at Berkeley Lab and developed with the help of an
international organization of physicists and educators, is pictured here along with some
of the many Berkeley Lab contributors who helped to see the project through. The nuclear
science wall chart, conceived at Berkeley Lab and developed with the help of an
international organization of physicists and educators, is pictured here along with some
of the many Berkeley Lab contributors who helped to see the project through.
Work on the chart began in 1995 with an effort by volunteers from Berkeley Lab's Nuclear Science Division, who presented a rough draft to the three-dozen-member, nonprofit Contemporary Physics Education Project (CPEP). "Partly we were inspired by the great success of the Fundamental Particles and Interactions chart that CPEP has distributed for years," says physicist Howard Matis of the Nuclear Science Division, an early leader of the project, "but perhaps more important was our perception that most high school students lacked basic knowledge of physics. I surveyed a number of schools and found that they all lacked materials to teach modern physics." The CPEP educators appreciated the amateur effort, finding it scientifically sound—but they also thought it rather stodgy. "Everything it showed had been done 50 years ago," admits Matis, "and later, when we tried to add contemporary science, the result didn't look coherent." At that point, Matis says, Rollie Otto, head of Berkeley Lab's Center for Science and Engineering Education volunteered to give the group a designer. A new chart was laid out with the help of designer Christopher Slye that, Matis says, emphasized "what's happening now, including some mysteries. After all, answering unanswered questions is why we do science." More meetings and more designs ensued. Artist Flavio Robles, Jr. of the Technical and Electronic Information Department joined the project and did additional graphic work, while the chart's authors prepared the companion book, Nuclear Science, A Teacher's Guide. In the spring of 1997, the prototype chart and guide were tested in some 250 schools in America, Australia, England, France, and other European countries. "The chart was enthusiastically received everywhere," says Matis. "After we'd analyzed the questionnaires, corrected some ambiguities, and made a few final changes, we finally went to press." The finished chart comes in three sizes: a whopping 59 1/2 by 41 1/2 inches for classrooms; 29 1/2 by 21 inches, perfect for the office wall; and a 16-by-11-inch "notebook size" for handy reference. You may preview the chart and guide online. For ordering information, visit the CPEP web site. |
|
|
|