

Climate Sleuths
Berkeley Lab scientists and state-of-the-art computing resources located at Berkeley Lab have helped to pioneer our understanding of global climate and the impacts of climate change.
Building on these successes, Lab scientists are now developing powerful climate models that will forecast climate change’s impact on ecosystems and human health and well-being around the world. The models will also project how various carbon-cutting strategies could curb global warming.
Here are some of Berkeley Lab’s recent highlights:
Understanding global climate by reconstructing the past
One of the deadliest snowstorms in U.S. history was the Knickerbocker Storm, a slow-moving blizzard that occurred in 1922 in the upper South and Middle Atlantic states.
Gil Compo, a climate researcher at the University of Colorado at Boulder and NOAA Earth System Research Laboratory, recently used the Department of Energy's National Energy Research Scientific Computing Center (NERSC) supercomputers at Berkeley Lab to recreate this storm, as well as the 1930s Dust Bowl and a 1938 hurricane that struck the East Coast.
NERSC is the flagship high performance scientific computing facility for research sponsored by the U.S. Department of Energy Office of Science. It is located at Berkeley Lab and is a world leader in providing resources and services that accelerate scientific discovery through computation.
Compo is leading a project to reconstruct global weather conditions in six-hour intervals from 1871 to the present. Called the 20th Century Reanalysis Project, these weather reconstructions will help researchers forecast weather trends of the next century by assessing how well computational tools used in projections can successfully recreate the conditions of the past.
This movie is a 20th Century Reanalysis Project reanalysis of a 1938 Hurricane, based on archived meteorological data. With data like this available for the entire 20th century, climate researchers hope to improve their models so that they can more confidently predict regional weather trends for the future.
Look to the clouds
In order to understand climate, scientists must understand how clouds behave and how they influence the atmosphere on a global scale — which is one of the great unknowns in climate science.
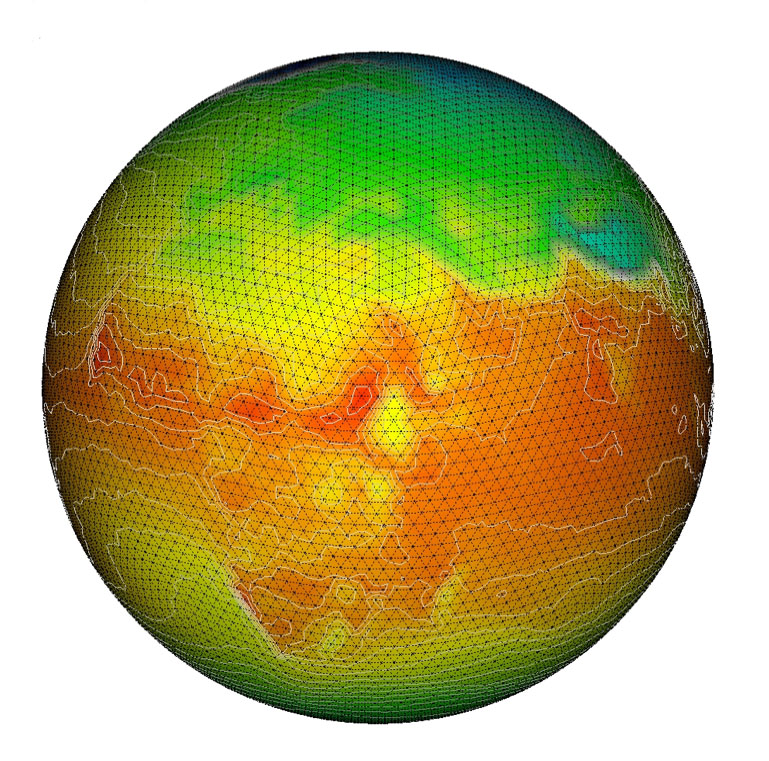
That could change. Scientists are developing a global cloud-resolving model, which is intended to simulate the motions of the atmosphere from a single thunderstorm to the entire planet. The project is part of DOE's Scientific Discovery through Advanced Computing (SciDAC) program and is led by David Randall, an atmospheric scientist at Colorado State University.
The model essentially blankets the Earth with a geodesic grid that consists of about 100 million hexagonal columns. Each of the grid cells encompass wind, temperature and humidity at points just 4 kilometers apart or even smaller, which is a resolution far higher than current models. The team recently tested the model using NERSC systems.
Ocean circulations and greenhouse gases
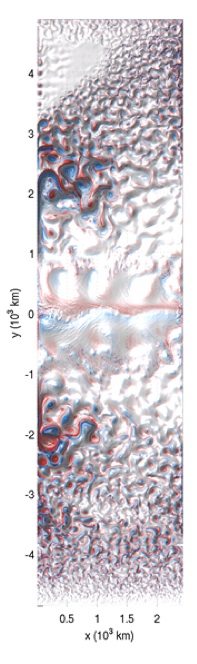
This image comes from a computer simulation modeling eddies in the ocean.
An interesting feature is the abundance of eddies away from the equator, which is shown in the center of the image. This image comes from a research collaboration that performed over 15,000 years worth of deep ocean circulation simulations with 1.6 million processor core hours on the upgraded Franklin system.
Another project led by Paola Cessi of the Scripps Institution of Oceanography performed over 15,000 years worth of deep ocean circulation simulations on Franklin –- NERSC's Cray supercomputer named in honor of Benjamin Franklin.
Insights from these experiments will give researchers a better understanding of how oceans circulate and how changes in the atmosphere affect these processes.
Cessi's project used Franklin to simulate how oceanic flows, which are driven by surface winds and differences in solar heating, bring heat from the deep ocean to the surface. Since oceans are the biggest repositories of carbon dioxide on the planet, this research could also provide valuable insights about how oceans cycle greenhouse gases into the atmosphere and across the globe.
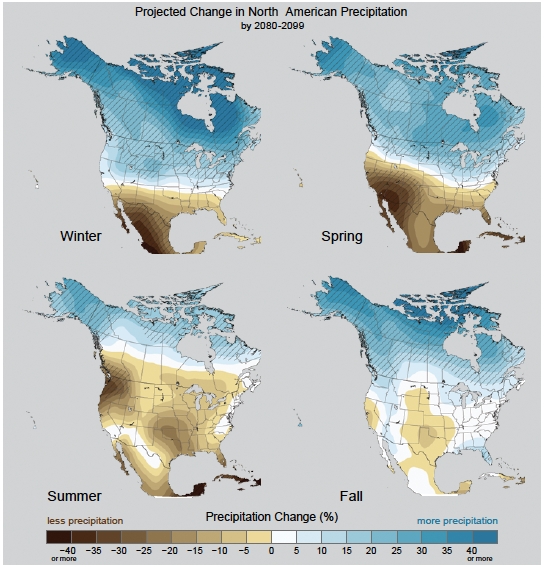
Precipitation map developed by Berkeley Lab’s Michael Wehner shows, among other things, a substantial reduction in springtime rains in California, and summertime rains in the Pacific Northwest.
Southwestern U.S. projected to get hotter
Climate change impacts on the southwestern U.S. are projected to include decreased rainfall and runoff, more drought and wildfire, and more days hotter than 100°F, according to a major report released this summer by the multi-agency U.S. Global Change Research Program.
Two Berkeley Lab researchers, Evan Mills and Michael Wehner, contributed to the report, which analyzes the effects of climate change on all regions of the U.S.
Wehner, who is a climate researcher in Berkeley Lab’s Computational Research Division, developed projections of future climate change for the report chapters covering global and national impacts of climate change. One of his research interests is extreme weather conditions resulting from climate change.
In addition to the precipitation map below, Wehner developed projections of the global mean surface air temperature, which is an indicator of the magnitude of the effects of global climate change. His projections are based on the most sophisticated climate models available.