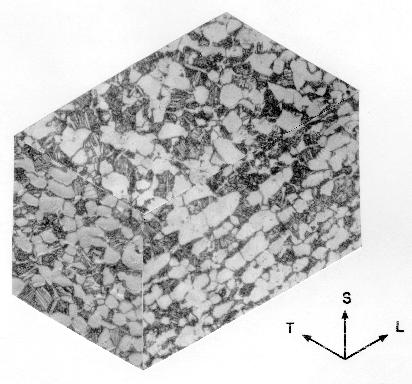
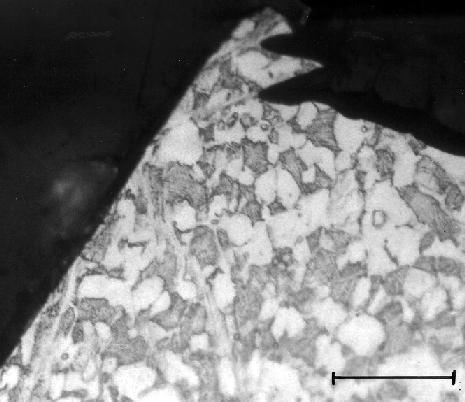
Figure 1: Optical micrographs of the microstructure of the STOA Ti-6Al-4V plate
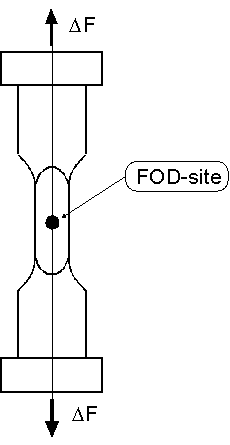
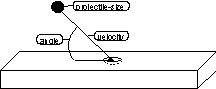
Figure 2: Schematic illustration of (a) the FODed "Kb" bar used for high-cycle fatigue testing, and (b) the detail of the impact conditions
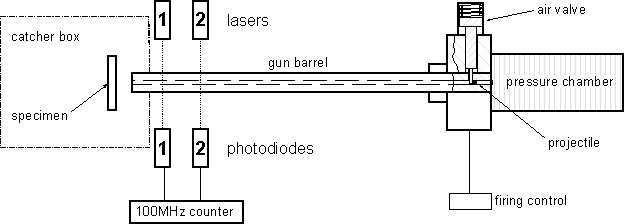
Figure 3: Schematic diagram of the high-velocity impact facility
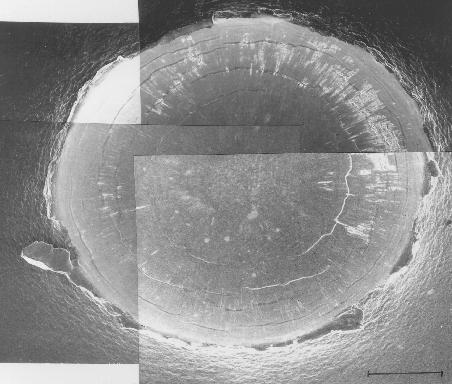
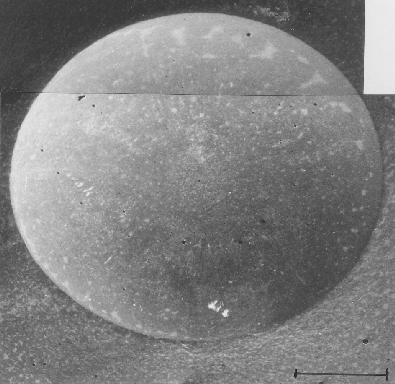
Figure 4: Scanning electron micrographes of simulated damage sites. Impact-conditions: 3.2mm chrome-hardened steel sphere, normal impact (90º) at impact velocities of (a) 309 m/s and (b) 201 m/s
 4
4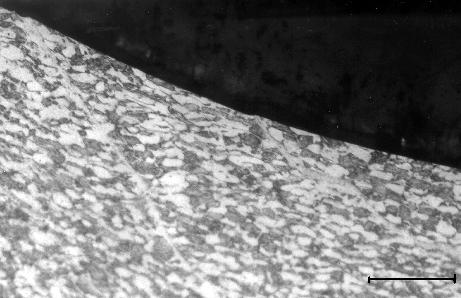
Figure 5: Optical micrographes of cross-section of simulated damage-site.
Impact-condition: 3.2 mm chrome-hardened steel sphere, normal impact (90º),
at 309 m/s.
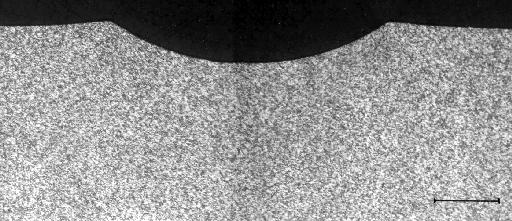

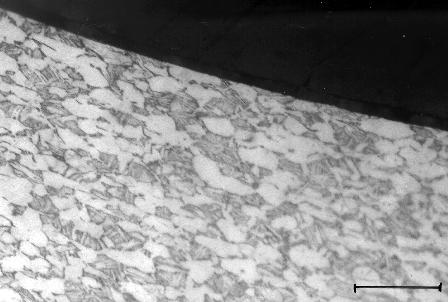
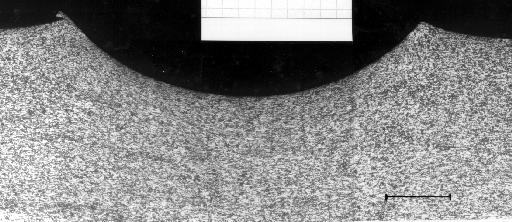
Figure 6: Optical micrographes of cross-section of simulated damage-site. Impact-condition: 3.2 mm chrome-hardened steel sphere, normal impact (90º), at 200 m/s.
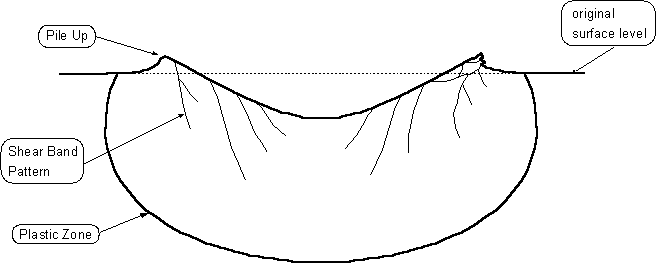
Figure 7: Schematic of the damage zone beneath an FOD impact crater
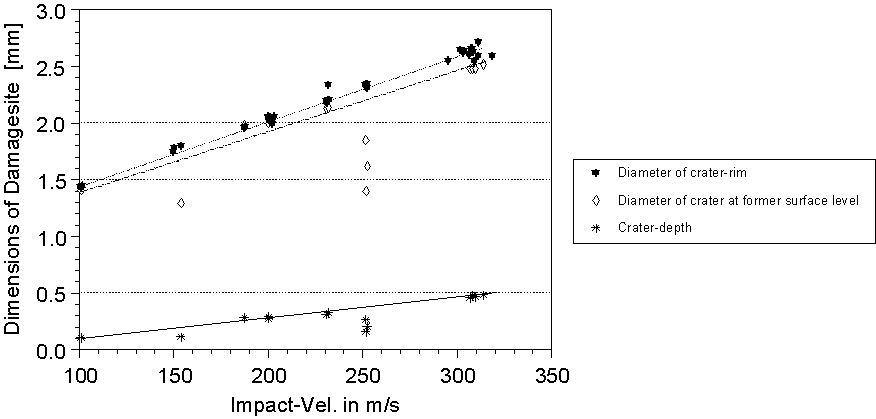
Figure 8: Influence of impact-velocity on dimensions of the damage from
a 3.2 mm chrome-hardened steel sphere under normal impact conditions