 |
| Boreholes are a staple of geophysical research. Instrumentation lowered into the holes can log data continuously during their descent or at strategic points along the way. |
Studying a World Through Little Holes
Sending instrumentation down into boreholes and wells remains a staple of geophysical research. Probes, lowered into the holes, report back what they "see," like so many miniature electro-mechanical Dantes. This data, collected either continuously as the probe descends, or at strategic points along the way, is logged in as a graphical display. Boreholes help scientists study fractures-breaks in the rock that include faults (if displacement occurs) and joints (if the rock is merely cracked). As the pathways through which subsurface liquids and gases move, fractures play a major role in the production of oil and geothermal energy as well as the transport of polluted water.
Majer has been a pioneer in helping to broaden the scope of borehole geophysics. Along with ESD geophysicist Tom McEvilly, he led the development of a technique called Vertical Seismic Profiling (VSP), in which sensors, lowered down a borehole, pick up seismic signals (vibrations) artificially created by a heavy tractor-like vehicle. Seismic signals that travel through the ground come in two forms; compressional or P waves, which cause rocks to move in the same direction as the vibrations, and shear or S waves, which cause rocks to move perpendicular to the vibrations. How fast these P and S waves travel and the rate at which they lose their energy reveals much about the rocks through which they pass. The VSP technique has been used extensively in a number of important geophysical sites including the Parkfield experiment. Parkfield, a tiny town in central California along the infamous San Andreas fault, has been a Mecca for geophysical scientists since 1985 when McEvilly made history with the first earthquake prediction ever to be scientifically validated. |
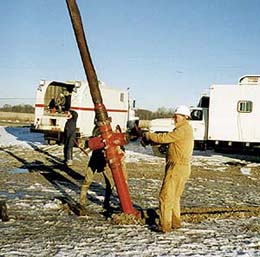
| This shear-wave vibrator sends signals into the earth in the form of seismic waves that yield information about the rocks through which they travel. |
Majer, along with Tom Daley and John Peterson, also developed a high-frequency (over 3,000 Hertz) cross-well seismic tomography technique in which the velocities of seismic waves are measured using multiple pairs of boreholes. In each borehole pair, the source of the seismic signal is placed in one hole, the seismic sensors are placed in the other, and signals are measured as they cross the ground between source and receiver holes. The procedure then becomes similar to the use of x-rays to obtain a CAT scan of the human brain. Signal data is recorded from multiple points and a computer is used to reconstruct a composite 3-D image. With seismic tomography, researchers get images that provide information on fracture locations, the continuity and thickness of rock layers, and other structural features. Majer and his colleagues are now using their cross-well seismic tomography technique to study the ground underneath the Test Area North (TAN) site at the Idaho National Engineering and Environmental Laboratory. TAN was once the site of nuclear-powered aircraft research and is now a U.S. Department of Energy (DOE) testbed for environmental remediation procedures. Susan Hubbard, Ken Williams, Yoram Rubin, and Majer have been exploring the use of ground-penetrating radar (GPR) as a supplement to borehole logging. Because GPR is noninvasive, it can provide high-resolution images of subsurface conditions without the need of boreholes that alter those conditions. This makes GPR a potentially valuable aid for environmental cleanup efforts. Explains Hubbard, "Much of the problem and initial cost of subsurface remediation comes from site characterization. Three-dimensional information about the heterogeneous subsurface is needed in order to identify the key controls on the flow and contaminant transport processes." Working at a DOE test site near the town of Oyster Bay in Virginia, the ESD geophysicists have demonstrated that with a combination of GPR and seismic tomographic data, they can obtain subsurface structural and hydrological information that would otherwise be obtained only through extensive and intrusive borehole sampling.
 |
|
|
Other ESD scientists are studying the all-important interactions between rock and water by exploiting electrical conductivity differences. Dry rock is an electrical insulator, but add even the tiniest bit of water and its conductivity increases enough so that the water's presence can readily be detected. A technique that has become a standard tool in borehole studies called "hydrophysical logging" was developed by the head of ESD's Hydrology and Reservoir Dynamics department Chin-Fu Tsang, along with ESD colleague Frank Hale and others outside of Berkeley Lab. In this approach, a borehole is filled with deionized (electrically neutral) water that is then slowly pumped out. This draws groundwater from rock fractures into the borehole where it mixes with and displaces the deionized water. "The electrical conductivity of the water coming into the borehole from a specific fracture will be different from that of the deionized water and or any other fracture because of its unique chemical content," says Tsang. Logging the electrical conductivity changes that accompany this displacement tells researchers which fractures are wet and which are dry, where the water came from and where it can be expected to go next. To see with their own eyes what's down in the borehole, a high-resolution digital borehole camera is maintained by the Geophysics Department's Geosciences Measurement Center. State-of-the art instrumentation is also available here for measuring and analyzing a broad range of geophysical properties of samples taken from boreholes. Recently, Majer and ESD colleagues have been participants in a large multi-institutional collaboration to develop "single-well seismic imaging," in which the seismic source and sensors are both deployed in a single borehole.
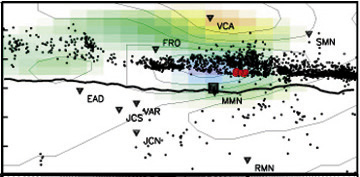 |
| Parkfield, CA, a tiny town on the San Andreas Fault, is a center for earthquake prediction research. The area is struck by a 6.0 magnitude earthquake every 20-30 years with thousands of micro quakes in-between. The black dots show recent seismic epicenters and the black line shows the fault. |
"The idea is to extend what we can learn about the area around a borehole out from the traditional one meter radius to an area 100 or more meters in any direction," says Majer. "Ideally, we would like to extend this information as far as one kilometer away from the borehole." One borehole limitation that can't be overcome is depth. Unlike Dante, the probes in boreholes get nowhere near the center of the Earth. The deepest borehole drilled so far made it down to about 12 kilometers (7.5 miles). That is just barely scratching below Earth's surface.
Concentric Circles
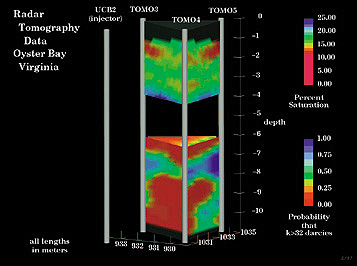 |
| Oyster Bay on the Delmarva Peninsula (insert) is a U.S. Department of Energy site for the study of bacterial movement through the soil. Bacteria follow the moisture and ground-penetrating radar is a non-invasive way to characterize hydrogeological conditions. Blue marks the wettest areas, red the most dry. |
To a point, Dante was right: our planet's interior is arranged in a series of concentric circles, but these circles are neither progressively smaller nor colder. According to prevailing models, the outermost circle, upon which the continents and ocean basins sit, where fossil fuels are stored and subsurface life resides, is called the crust. Under the oceans, the crust is about eight kilometers (five miles) thick and made up largely of basalt (hardened lava). The crust under the continents is about 40 kilometers (25 miles) thick and made up largely of granite. Below the crust, and going down nearly 3,000 kilometers (1,800 miles) is the mantle, a sphere of silicon, oxygen, aluminum, iron and magnesium. The mantle is separated into upper and lower portions. The upper third of the mantle is solid but fractured into about two dozen interlocking pieces or "plates." These plates, along with the crust that covers them, comprise Earth's "lithosphere." The lower two-thirds of the mantle-called the "asthenosphere"-has been softened to a texture some geologists liken to Silly Putty by temperatures that approach 4400 degrees Celsius (8000�F). Lithosphere plates are thought to slide over this pliant layer like giant bars of soap across a wet floor. Over a geological time-scale, the slippery motion would account for continental drift and the faults that give rise to earthquakes. Below the mantle are Earth's outer and inner cores. The outer core is about 2,250 kilometers (1,400 miles) thick and made up of molten iron and nickel. Temperatures here are believed to reach as high as 6100 degrees Celsius in the deepest part. At the center of the Earth, about 6,400 kilometers (4,000 miles) below the surface, is the inner core, a ball of iron perhaps including some nickel, approximately 2,600 kilometers (1,600 miles) in diameter. Despite a temperature that could be as high as 7000 degrees Celsius (13,000�F), the inner core remains solidified by the enormous pressure at that depth.
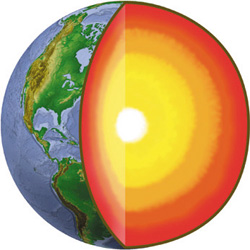 |
| Seismic data has shown that the interior of the earth is distinctly layered. The continents and ocean basins are embedded on a thin crust wrapped around a mantle, the upper part of which may be partially molten. Under the mantle is a molten outer core of iron and nickel and in the center is an inner core of solid iron. |
Because there is no direct means of sampling the Earth's interior from the mantle on down, information must be derived indirectly, mainly from measuring the velocities of seismic waves as they cross through the earth. This is like cross-well logging, only the signal source is an earthquake and the receivers are the more than 1,000 seismographic stations around the globe. Scientists compare the velocity and strength of P and S waves as they move away from an earthquake's epicenter, which can be precisely identified through the convenient fact that P waves travel nearly twice as fast as S waves. This indirect sampling technique has a built-in bias because earthquake epicenters are clustered around plate boundaries and the majority of the world's seismographic stations are located in the northern hemisphere. Furthermore, scientists collecting measurements of seismic velocities have generally concentrated on either the crust, the mantle or the inner core, using aspects of seismic wave travel time that are most sensitive to those specific regions. For reasons that will be explained shortly, the outer core has largely been ignored. ESD's Geophysics Department maintains a Center for Computational Seismology. A significant advance towards a better understanding of the world below was made in 1998 when researchers at this center unveiled the first three-dimensional images of the Earth's entire interior structure, from the crust down to the inner core. Center geologists Don Vasco and Lane Johnson constructed their images CAT scan-style from seismic data collected on thousands of earthquakes over the past 40 years. One of the first surprises to emerge from these images was a suggestion that decisions to ignore Earth's outer core were based on the faulty assumption that it is homogenous. Conventional scientific wisdom held that the core's nickel and iron would be thoroughly mixed and evenly dispersed throughout like the ingredients of a sauce heated to boiling. "We found indications of heterogeneity rather than homogeneity at the bottom of the outer core," says Vasco. "It looks like high pressures and temperatures are causing nickel-rich iron to solidify at the base." The depleted iron that remains molten would be less dense than the fluid above, causing it to rise and creating a convection current. This could account for Earth's magnetic field, Vasco says. The depleted iron circulates through the core, creating a magnetic field in much the same manner as the motion of metallic wires produces a current in an electric generator. Heterogeneity in the outer core would also be in keeping with geophysical evidence that Earth's magnetic poles have at times waxed and waned in strength and have even reversed themselves. "The process is dynamic, so when we image an object or a certain condition we shouldn't expect things to stay that way forever," says Vasco. "Think of it as an ocean. An ocean is well-mixed, but there will still be pockets of warm or cold water. They won't stay that way for long but they will exist for a time."
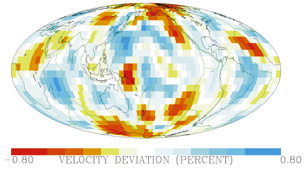 |
| Measuring the travel times of seismic waves passing through the earth is helping Berkeley Lab scientists create the first 3-D images of the entire interior, including the outer core, the region from which our planet's magnetic field is generated. |
Vasco and Lane produced their first 3-D model of the world below using workstations. During the past year, they have been working with the supercomputers operated by DOE's National Energy Research Scientific Computing Center which is housed at Berkeley Lab. The enormous boost in computational power and speed is enabling them to check the reliability of their model and determine which features work best. They are also improving the resolution of their images and finding more surprises, even from the extensively imaged mantle. For example, Vasco and Lane's images indicate that portions of the solid plates might extend deep into the lower portion of the mantle, perhaps as far down as the outer core. Images starting to come in from other research groups hint at this as well. "We all seem to be getting similar images, but the interpretations can wildly vary," says Vasco. "It is sometimes difficult to say what is geophysical and what is an artifact." In addition to seismic waves which travel through the earth, there are also seismic waves which travel over the surface of our planet. Vasco and his colleagues at the Center for Computational Seismology plan to supplement current images with surface wave data that would enhance the reliability and the resolution of their models. They are also looking into ways of expanding interior seismic information which is presently concentrated along "subduction zones," areas where plates grind against one another, to "craytons," areas of geological stability. Majer says the use of supercomputers will improve the accuracy of subsurface modeling, but still won't come "anywhere close" to solving all the geophysical variables that can shake, rattle and roll the world below. "In the end," he says, "all we can do is make the best models we can, then see how close we come by drilling more little holes." end