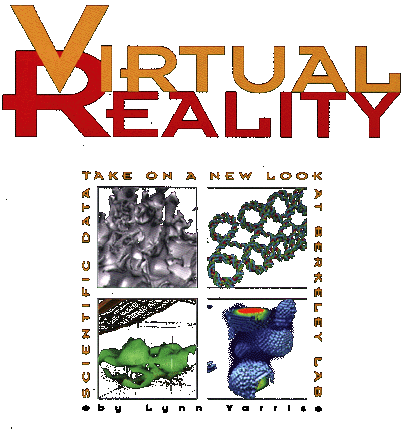
by Lynn Yarris | Our senses are intelligence gatherers for the brain, the way-stations through which we learn about the world around us. As a species, our foremost path of learning is sight; some 25-percent of the cerebral cortex (the thinking cap in our brain) is devoted to processing visual data. None of the other senses comes close. Accordingly, a growing number of scientists are looking to powerful new computing capabilities such as those at Berkeley Lab's National Energy Research Scientific Computing Center (NERSC). With the right combination of computer capabilities and skills, the voluminous columns of numbers making up scientific data sets can be translated into graphical three-dimensional images that make it easier for researchers to study and learn. Such a blend of capabilities and skills can be found in Berkeley Lab's Visualization Group.
The group is led by Nancy Johnston, a computer scientist since the mid-70s when graphic representation of data meant two-dimensional line plots. Other members are Wes Bethel, Kevin Campbell, Stephen Lau, and Terry Ligocki. Johnston credits the transformation of her old "Graphics Group" into today's Visualization Group with the hiring of Bethel in 1990.
Bethel was brought in to "tame, explore and apply" a new interactive graphics program that was designed to transform numerical data into 3-D images. Called the Application Visualization System (AVS), this program is still used by the group today but has been supplemented with a second graphics package called Khoros for the Greek spelling of "chorus." The group's hardware has changed, too, and now includes a workstation from Silicon Graphics, the industry leader in visualization, plus a large (4.5 sq. meters) rear projection screen. However, the repertoire of the group's hardware could be different even by the time you read these words.
