BERKELEY, CA -- It's one thing to strike oil, another to get it all out
of the ground. Reservoirs are often prematurely abandoned because of "oil behind the
hole" -- pockets of hydrocarbons that wells completely miss. Better ways of seeing
what's down there are crucial to efficient use of the nation's energy reserves.
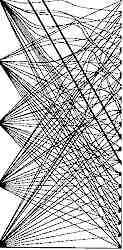 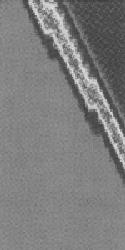 In a lab model,
travel-time data from wavefield transforms is used to compute raypaths from five
transmission points in a borehole to 21 reception points in a second borehole. The
resulting tomogram translates pronounced bending of raypaths, indicating abrupt changes in
speed, to picture a region of changed conductivity between boreholes
|
A new method for making images of the subsurface has been devised by Ki Ha Lee of the
Department of Energy's Lawrence Berkeley National Laboratory. Lee and his colleagues in
the Earth Sciences Division use data generated with electromagnetic energy (EM) in a novel
way that can visualize the subsurface at depths ranging from gas and oil reservoirs
thousands of meters deep to plumes of pollutants in shallow soil.
"Electromagnetic energy tends to propagate without loss in free space, but in the
ground the story is very different," Lee says. "The ground attenuates the signal
severely, especially at the higher frequencies. Instead of propagating like a wave in
space, an EM field diffuses into the ground almost like heat does through a solid
medium."
Traditional EM imaging techniques involve transmitting signals, then acquiring and
processing the data to map the distribution of subsurface electrical resistivity. Signals
can be sent between boreholes, between the surface and the borehole, or from surface to
surface. Signals vary in strength according to the electrical resistivity of the material
through which they travel; oil-bearing sand, for example, can be ten times as resistive as
surrounding clay or carbonates.
Unfortunately, differences in resistivity can be detected confidently only at close
range. Lee compares the process of detecting diffuse EM signals to "measuring the
temperature" at various points underground. Away from the measurement points the
spatial resolution of resistivity is usually limited, but drilling boreholes close
together for better resolution is prohibitively expensive.
While Lee uses low-frequency, diffusive, electromagnetic data sent between boreholes,
his method allows better images to be constructed at greater range, significantly reducing
drilling costs. He employs a clever mathematical transformation to convert diffusive EM
signals into "wavefields;" the resistivity image is constructed using the
transformed wavefield's travel times.
Examples of wavefields include familiar seismograms, which make use of earthquakes or
other earth-shaking events, and sonar, which is based on underwater sound waves. Radar
works in a similar way, using electromagnetic waves which travel well in air or vacuum but
can penetrate only a little way into the ground. All depend on signal travel time to
construct images.
In converting low-frequency EM data to wavefield form, Lee transforms the real-time
electromagnetic fields to mathematical equivalents which are easier to manipulate. Thus he
can apply familiar methods for using time-dependent data to generate tomograms -- maps of
two dimensional slices -- of the geological structures between the receivers and
transmitters.
In a typical use of the technique, a receiver is held steady in one borehole and a
transmitter is moved down a different borehole to different locations, at each of which it
sends out a signal. Next the receiver is moved to a new fixed position; the transmitter
again transmits from different locations.
The result is a series of signals emitted at various depths, each of which is also
detected at various depths. Rays can be drawn connecting each transmitter point with each
receiver point, representing discrete paths of the signals; from the travel times along
these raypaths the image is constructed.
In a heterogeneous medium the raypaths are usually curved, because the travel time
between a given transmitter-receiver pair depends on the distribution of differences in
resistivity along the path -- the more the electrical resistance, the faster the travel
time. To construct an image, all the raypaths are combined as if generated at the same
time. Thus the distribution of resistivity between the boreholes is constructed as a
tomogram representing local geological conditions.
Lee and his colleagues first tested the new method in a homogeneous medium, a block of
graphite in the laboratory. The success of these tests led to construction of a full-scale
transmitter, which has been field-tested at the University of California's Richmond Field
Station. A combined transmitter-receiver field test is planned this year with the help of
Western Atlas Logging Services in Houston. A final data-processing phase will follow.
Only about a fourth of the oil and gas in known reservoirs is recovered, and some 40
percent of the nation's reserves reside in already-discovered reservoirs. The new imaging
technique developed by Lee and his colleagues will make it easier to find what's been
bypassed. The same methods can be used to characterize environmental problems and monitor
their remediation.
The Berkeley Lab is a U.S. Department of Energy national laboratory located in
Berkeley, California. It conducts unclassified scientific research and is managed by the
University of California.