|
January 29, 2003
|
||
|
 |
 |
|
Envisioning the Grid |
||
| Contact: Paul Preuss, paul_preuss@lbl.gov | ||
|
|
The Wizards of Viz At last year's SC2002 conference in Baltimore, Berkeley Lab racked up its third straight win in supercomputing's annual Bandwidth Challenge with a data-gobbling visualization of colliding black holes. When it comes to remote scientific visualization, says Wes Bethel with a smile, "we're the kings." Now Bethel and John Shalf of the Computational Research Division's Visualization Group have followed up their SC2002 success by writing a good chunk — including the guest editorial — of the March/April, 2003, issue of IEEE Computer Graphics and Applications, which is devoted to graphics on the Grid.
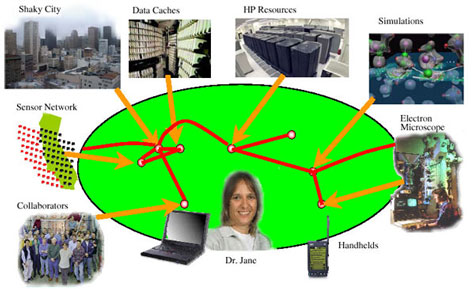
"The Grid integrates all sorts of devices, services, and resources, not just computers," Shalf says. Operating inside a specialized world of research, the Grid hopes to do for the tools of science, from computers and data-storage systems to instruments like telescopes, electron microscopes, seismographs, synchrotron beam lines — even oceangoing floats that report via satellite — what the World Wide Web did for desktop PCs. But Berkeley Lab's bandwidth champs are far from complacent about the future of visualization on the Grid. In fact, Bethel and Shalf argue, there is a "wide gulf between current visualization technologies and the vision of global, Grid-enabled visualization capabilities." Their editorial focuses on the gulf between enthusiasm bordering on hype,
on the one hand, and on the other, the tools that can actually be used
by scientific researchers in their day-to-day research activities. In
the process, the editorial highlights several of the most important technical
challenges facing the Grid visualization community.
"The vision is a noble one," says Bethel, "but there is a huge gap between it and what can be done at present." One issue is what Bethel calls the "Tower of Babel" problem: "A major objective of the Grid is a uniform means of communication. But in order for Grid components to be able to communicate, they must all speak the same language, using the same conventions. In the visualization world, there are many different data file formats and grid types, and no widespread agreement about how to go about having disparate software components interact with one another." A closely related concern is security. "The Grid couldn't work if a user had to log into all these sites separately," Shalf remarks. Yet in working toward secure sign-ons "the Grid community has spent too much time on getting different components to talk to each other" — at least from the standpoint of effective visualization systems. Lossy versus bossy Part of the problem is that "historically, network specialists have a fear of lost data." In a major article in the same issue of Computer Graphics and Applications, which draws on their experience with the SC2002 Bandwidth Challenge, Bethel and Shalf characterize the data-loss issue as one of balancing "the competing interests of interactivity and fidelity" — determining when absolute accuracy is needed and when it is not. "The visualization community has long worked with missing data," Bethel notes. "So John and I asked whether it is hypocritical to insist that a visualization system preserve every single bit in the datastream, without loss. After all, MPEG movies and JPEG images are lossy, yet are widely accepted within the scientific community. The challenge is to have predictable behavior with loss in the data used to create the visualization, not just with lossy compression of images resulting from the visualization process." In one of the two broad approaches that characterize present systems, the visualization is first performed on a single server, then sent to the client — an approach that can handle large datasets but stonewalls interactivity. The other approach is to transfer subsets of data that are assembled on the client's desktop — which is fine for interactivity but can't keep up with the ever-increasing size of scientific data sets or the limitations of finite network bandwidth. Both these approaches preserve the integrity of the data as it travels the internet. Neither works if large datasets and interactivity are needed simultaneously. Volume rendering in full 3-D uses up a lot of computing power and bandwidth; some systems take hours to render a single frame. Yet, says Shalf, "Loss of data may not have much of an impact if it doesn't lead to misinterpretation." The volume-rendering program named Visapult, whose development was spearheaded by Bethel, was designed to work quickly over the network using a combination of parallelism, pipelining, and novel "latency-tolerant" visualization and graphics algorithms. |
|||||||||||||||||||