HMEC Aging resource

The HMEC Aging Resource is a collection of over 50 primary human mammary epithelial cell strains that were est.ablished from reduction mammoplasty specimens and from non-tumor tissue that was peripheral or contralateral to breast tumors. At the time of surgery the patients ranged in age from 16 to 91 years. The strains are genetically normal, finite lifespan, pre-stasis HMEC and the presence of all identifiable lineages in breast have been verified in low passage cultures (up to 8th passage), as well as the presence of multipotent progenitor/stem activity. We have verified through transciptomic, epigenomic, biochemical, and functional assessments that the footprints of chronological age is preserved in our cultured strains. In addition to the established primary strains we have frozen uncultured epithelial organoids and isogenic fibroblasts from over 400 women, from which we continue to make new strains
A basic description of the strains is coming soon!!!!
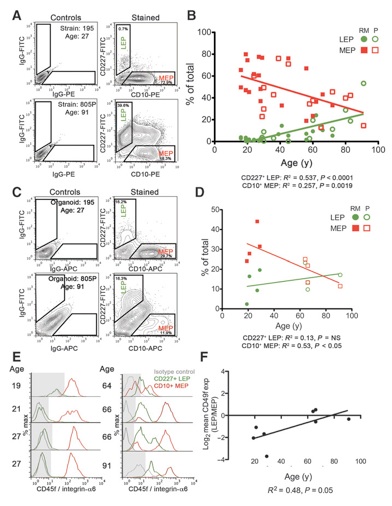
Figure 1 from Garbe etal 2012:
Epithelial lineages change as a function of age. A, representative FACS analyses of CD227 and CD10 expression in fourth-passage HMEC strains isolated from one woman younger than 30 years (195L) and one older than 55 years (805P). FACS plots are shown as 5% contour plots with outliers identified; left, isotype antibody controls; right, the CD10- and CD227-stained samples. Gates identifying luminal epithelial (LEP) and myoepithelial (MEP) are shown. FITC, fluorescein isothiocyanate; PE, phycoerythrin. B, linear regression showing changes in proportions of LEPs (green) and MEPs (red) in HMEC strains at fourth passage as a function of age (n . 36 individuals). LEPs and MEPs from reduction mammoplasty (RM)-derived strains are shown with filled circles or boxes and from peripheral to tumor (P)-derived strains with open circles or boxes, respectively. C, representative FACS analyses from the corresponding uncultured dissociated epithelial organoids. FACS plots are shown as 5% contour plots with outliers identified; left, isotype antibody controls; right, the CD10- and CD227-stained samples. APC, allophycocyanin. D, linear regression of proportions of LEPs (green) and MEPs (red) in dissociated uncultured organoids as a function of age (n . 8 individuals). LEPs and MEPs from RM-derived organoids are shown with filled circles or boxes, and from P-derived organoids with open circles or boxes, respectively. NS, not significant. E, histograms of CD49f (integrin-a6) expression by flow cytometry on CD227. LEPs (green lines) and CD10. MEPs (red lines) from dissociated organoids. The gray-colored shade boxes indicate the threshold at which there is little or no CD49f expression as determined in isotype negative control stains (gray lines). F, regression analysis of log2 change in mean expression of CD49f in LEPs normalized to the levels in MEPs from dissociated organoids as a function of age (n . 8 individuals).