| November 29, 2005 | science@berkeley lab | | lab a-z index | lab home |
|
|||
| Balancing California's Energy | ||||||||||||||
| Contact: Allan Chen, a_chen@lbl.gov | ||||||||||||||
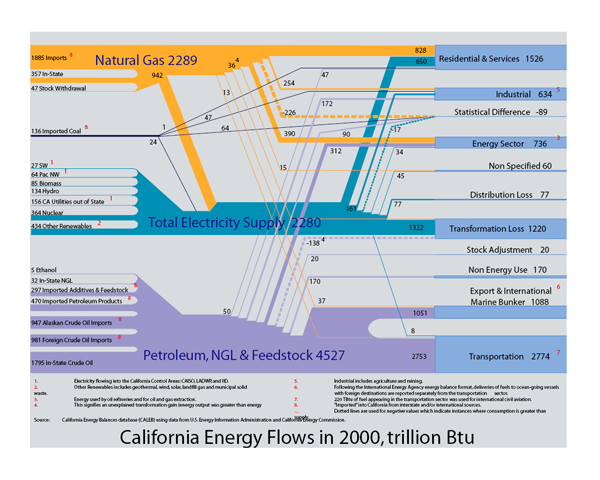
| How much energy does the California economy use, how is the energy supplied, and what is it used for? For reasons related to the economy, the environment, and energy security, a lot of people are interested in these questions. The California Energy Commission recently funded scientists in Berkeley Lab's Environmental Energy Technologies Division to help find some answers. They did so by developing the California Energy Balances Database (CALEB), and issuing a report — with this flow chart as its centerpiece:
To make the energy sources comparable, researchers have converted them all into trillions of Btus (British thermal units), even though particular sources of energy are usually discussed in terms of units characteristic of the sources — for example, kilowatt-hours are typically used for electricity, and millions of therms for natural gas. This is not the first time that someone has looked at how California's energy supply is transformed and used. However, it is significant as a comprehensive effort to resolve some gaps in the known flows of energy that stem from different methods of gathering statistics. One reason for the state's interest is that accurate energy consumption data are prerequisite to a reliable inventory of California's greenhouse gas emissions, an inventory now being conducted by the California Energy Commission. The data are also prerequisite to developing effective plans for reducing those emissions. California Governor Arnold Schwarzenegger recently issued an Executive Order requiring the state to develop such a plan. Much of CALEB's data is based on statistics gathered by such agencies as the California Energy Commission, the U.S. Department of Energy's Energy Information Administration, the U.S. Geological Survey, and the California Air Resources Board. But because different counting methods can lead to slightly different results, it was essential to make data from these different sources compatible: someone needed to make sure that all the basic inputs — coal, petroleum, natural gas, nuclear, and renewable sources — equaled all the outputs, plus losses caused by the basic physics of energy conversion and transmission. The flow chart presented here is Berkeley Lab's answer to this problem. "We had to make sure there was no glaring inconsistency on the supply side compared to the figures the state is using on the demand side," is how Scott Murtishaw, primary author of the study, puts it. Surprises and nonsurprisesThe size of the colored bars in the chart, and where they go from left to right, can tell the viewer a lot about energy in California at a glance. Even a quick look at the chart is likely to yield some surprises. One fact that's not suprising is that in a state with so many motor vehicles (nearly 30 million registrations, of which more than 18 million are automobiles), petroleum and a miniscule amount of other transportation fuels, mainly ethanol and natural gas, account for half the state's total energy use. What may be surprising, however, is how much of that is accounted for by marine bunker fuel, used by maritime vessels — a little under one-fourth of the petroleum input. "That's a consequence of having three of the United States' largest ports in California," Murtishaw points out, namely Long Beach, Los Angeles, and Oakland.
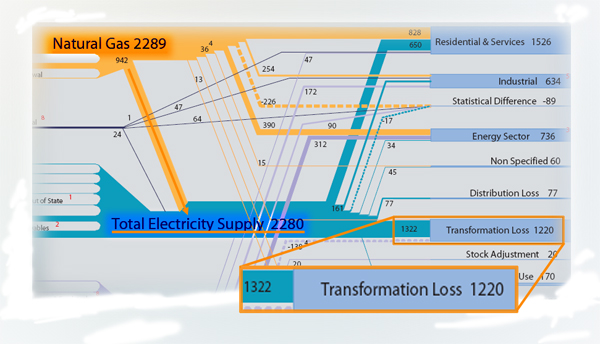
Another interesting observation is that the burning of natural gas provides a substantial amount of electricity in California. Take a look at the yellow bar at the top of the chart branching out and merging into the blue "Total Electricity Supply" bar, which goes from left to right. "This large dependency means that a rise in natural gas prices will not only affect winter heating bills," says Murtishaw, "but electricity prices as well." Also worth noting is that thanks to basic physics, large energy losses result when fuel input is converted, for example by burning coal or gas to generate electricity. This is evident in the light blue bar on the center-right labeled "Transformation Loss." At an estimated 2,280 trillion Btu, these losses represent more than half the total electricity supply. Consumers don't get to use the lost energy, but they still pay for it, in the sense that the cost of building power plants is embodied in utility rate structure, and laws of physics limit the efficiency of conversion in these power plants. Note that there are still some statistical uncertainties, indicated by flows into the "Statistical Differences" box. Negative numbers indicate instances where consumption appears to be greater than supply, for example in petroleum and natural gas use. These uncertainties need more research to resolve. Other features of California's energy balance are only evident when you compare them to other states. For example, California's mild climate means that less energy is used for space heating in the winter. The bar on the top right labeled "Residential and Services" is proportionally smaller than it would be for a state with harsh, cold winters. And because California, relative to Midwestern and other states, does not have much energy-intensive heavy industry like steel, concrete, or aluminum manufacturing, the "Industrial" energy bar is also proportionately smaller.
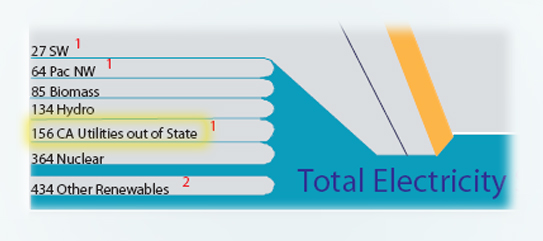
Finally, Murtishaw notes the bar representing energy from "CA Utilities Out of State" in the far left center of the chart: although small, it is interesting. " California investor-owned utilities are among the few that own large out-of-state power plants," he says. The study, "Development of Energy Balances for the State of California," was prepared by Scott Murtishaw, Lynn Price, Stephane de la Rue du Can, Eric Masanet, Ernst Worrell, and Jayant Sathaye. Additional information
|
||||||||||||||
| Top | ||||||||||||||