| June 24, 2002 |
|
 |
 |
| Biosig: A Program To Find New Meaning In Microscope Images | |
| Paul Preuss, (510) 486-6249, paul_preuss@lbl.gov | |
|
|
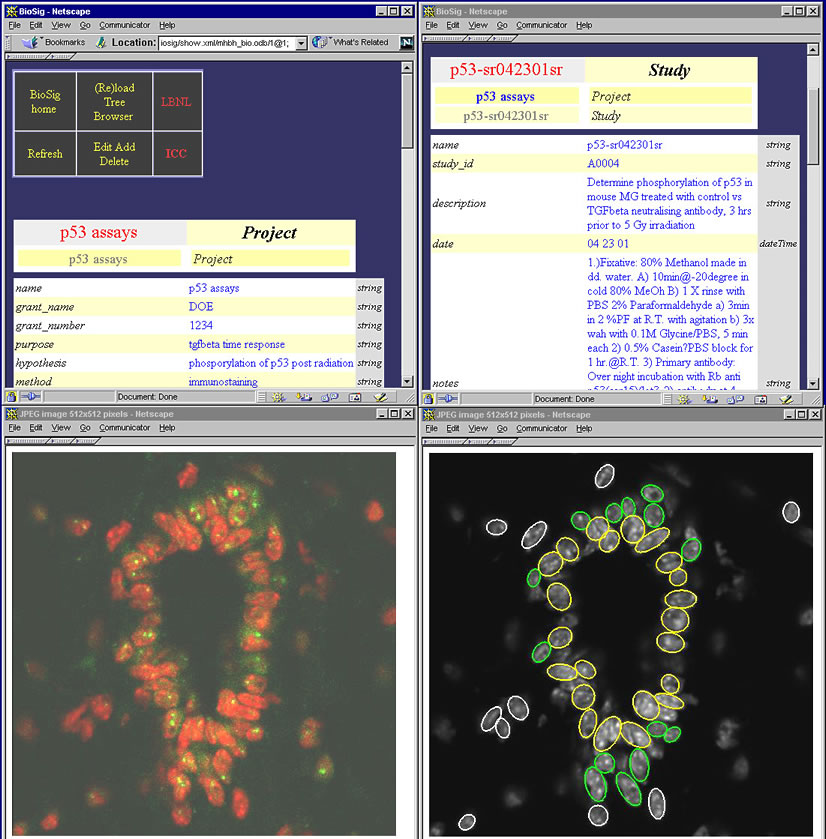
BERKELEY, CA � A team of computer scientists working with cell biologists at Lawrence Berkeley National Laboratory has created BioSig, a web-based bioinformatic system that links collections of microscope images to a wide variety of quantitative experimental data. The new program can be used by multiple researchers to answer questions and test hypotheses about protein expression, cell morphology, and cellular organization in tissues and cell cultures.
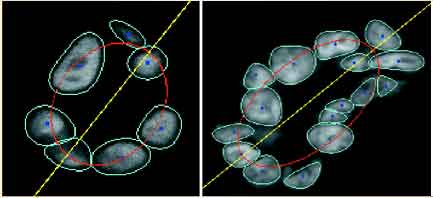
Mary Helen Barcellos-Hoff of Berkeley Lab's Life Sciences Division and Bahram Parvin of the National Energy Research Scientific Computing Center (NERSC) are coprincipal investigators of the BioSig system, which for the first time makes quantitative, image-based data available flexibly and rapidly on a large scale. They describe BioSig in the July 2002 issue of Computer magazine, published by the Institute of Electrical and Electronic Engineers (IEEE). Trained as a microscopist, Barcellos-Hoff studies the effects of low-dose radiation and other factors on cells and their environment. "Cell biologists love a good microscope image," she says, "but a radiation biologist is likely to say, 'Well that's pretty, but what does it mean?' Radiation biology is classically a quantitative field. It has been difficult to put new information gained from microscopy into quantitative form." Computer scientist Parvin has a particular interest in feature-based representation of scientific images. "How do you represent images so that such a representation reduces the data volume, and at the same time is information preserving? What quantifiable insights can you obtain from an image collection?" With BioSig, Barcellos-Hoff and Parvin have given quantitative meaning to microscope images in a way that promises far-reaching consequences for the field they have dubbed "phenomics," which deals with the proteins a genome codes for -- how they are regulated and expressed in the cell and how they interact with each other to condition the cell's responses to outside stimuli and a changing microenvironment. A sharper image of proteins at work Any biological system exhibits significant variations to begin with. Coupled with technical variability in sample preparations, image representation becomes quite heterogeneous: staining is nonuniform, images are noisy, and subcellular compartments can overlap each other. Each compartment within the cell must be clearly separated from its neighbors in a process called segmentation. Yang and Parvin developed a means of segmentation that removes noise and clearly outlines each cell or nucleus in two-dimensional images as readily as in 3-D ones; their method is completely automatic and does not require human interaction, as other segmentation programs do. The routine recognizes curved sections of the envelopes or membranes of nuclei. By calculating individual "centroids" from this information, adjacent objects can be distinguished even when they overlap. With further calculation, the location and magnitude of expressed proteins -- identified by specific antibodies -- can be resolved with great precision. Tracking degrees of freedom For example, when studies involve different strains or species of animals over time, says Parvin, "How do you compose a picture of time-varying quantitative information, within and across species, for many experimental variables?" The answer Parvin and Barcellos-Hoff came up with was to annotate each image with a wide range of factors, many of which come straight out of the experimenter's lab notebook and can be displayed in notebook format in a separate window on the BioSig screen. The NERSC computer science team gained a detailed understanding of experimental protocols through numerous discussions with different scientists in the Life Sciences Division. NERSC's Fontenay worked with Parvin to develop a flexible framework for annotating experimental images with computed features, to accommodate additional input from the BioSig user, and to make the information available over the web, where it can be used by researchers working alone or together on a wide range of problems. His design leverages the latest open-source tools like Apache servers; Apache's XML-based web publishing framework, Cocoon; and industry-tested Java application servers. Asking new kinds of questions
In their article, Barcellos-Hoff and Parvin use two applications to illustrate BioSig's ability to track different variables in complex situations: an in vitro study of how colonies of human breast cells are influenced by the extracellular matrix and an in vivo study that looked at two important regulatory proteins interacting to control DNA damage-response in mouse mammary cells. In the in vitro study, BioSig allowed the researchers to establish the pathways by which radiation and a protein modifier, acting separately and together, affect the formation of crucial structures in human breast cells. In the in vivo study, BioSig was used to quantify a link between an extracellular factor and intracellular response in mouse mammary glands. By enabling researchers to save and access large amounts of quantitative information in images, BioSig makes them useful in ways never before practical. BioSig also constitutes a "hypothesis-generating data model" with the potential for testing new ideas by querying experimental information in an existing database, and even importing "legacy" data, which may have been gathered for a completely different purpose. Research leading to the development of BioSig was principally supported by the Department of Energy's Office of Science through its Office of Biological and Environmental Research. For details see "BioSig: an imaging bioinformatic system for studying phenomics," by B. Parvin, Q. Yang, G. Fontenay, and M. H. Barcellos-Hoff, in the July, 2002, issue of Computer, or visit the BioSig website. The Berkeley Lab is a U.S. Department of Energy national laboratory located in Berkeley, California. It conducts unclassified scientific research and is managed by the University of California. |
|||||||||||||