|
January 29, 2003
|
||
|
 |
 |
|
Envisioning the Grid, part 2 |
||
| Contact: Paul Preuss, paul_preuss@lbl.gov | ||
|
|
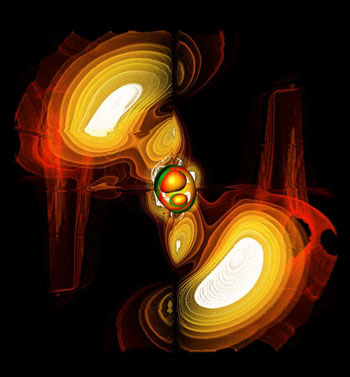
Berkeley Lab won the SC2002 Bandwidth Challenge by running the Visapult program to view the results of black-hole collision simulations. The simulated collisions were produced by the Cactus program, developed by the General Relativity group at the Albert Einstein Institute in Potsdam, Germany. Up to 16.8 billion bits a second streamed from a Cactus simulation to the Visapult application in Baltimore through an intricate network of high-speed connections in Europe and the U.S.
It takes a capacious transmission line — a "fat pipe" — to carry 17 billion bits a second, and moving lots of data fast is an essential feature of the science Grid. "The scientists all want fatter pipes," Shalf remarks, "but if they can't fill them, it will be hard for anyone to demand network improvement." The data-transfer protocol favored by network specialists is Transmission Control Protocol (TCP) — emphasis on "control" — which identifies individual data packets at the source, then reassembles them in precise order at the receiving end before the user ever sees the result. Data packets can spend a lot of time on hold, waiting to be assembled in the right order or awaiting the retransmission of a lost packet. TCP includes a congestion-avoidance algorithm that forces it to cut back its speed by half for each packet-loss event, then return to full speed only very slowly. Consequently TCP network utilization efficiency is only about 25 percent. One of the tricks Visapult used to gulp from Cactus's data firehose was a different version of the internet protocol known as the User Datagram Protocol (UDP) — emphasis on "user." Unlike TCP, which rearranges out-of-order packets and requests retransmission of dropped packets, UDP merely sends packets from one machine to another; it's up to the application to detect when they arrive out of order or if one has been lost. TCP is actually a control layer built atop the more fundamental substrate of UDP. By going back to the UDP protocol the Berkeley-led Bandwidth Challenge team were able to reengineer the fundamental behavior of the protocol, particularly its response to loss, an issue Visapult addresses by providing a manual throttle for TCP's congestion-avoidance behavior. The Cactus/Visapult combination's custom UDP-based protocol was able to use better than 90 percent of the available network bandwidth — and deliver the win. "At SC2002 we filled the pipe using a custom UDP protocol," says Bethel. "But to do it, we had to confront the issue of potential loss of data, as well as transmission-induced data reordering." A full-scale Cactus simulation requires three to five trillions of bytes of data, far more than real-time visualization can handle. The Bandwidth Challenge showed that loss is not only tolerable if its effects can be managed, it's essential if the goal is interactivity in the presence of huge amounts of data.
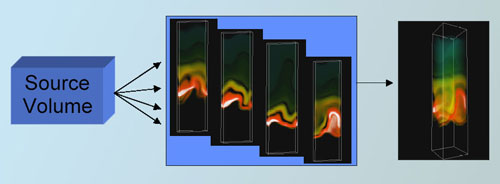
Visapult's basic design solves some of the problem through an architecture
known as pipelining: one of the components in Visapult's pipeline is housed
on a multiprocessor supercomputer and imports and reads all the data.
During first-stage processing, the data size is effectively reduced by
an order of magnitude. The result, a partial visualization, is then transferred
to the Visapult viewer. As the second component in Visapult's pipeline,
the viewer runs on a desktop workstation or a laptop computer. In this way the evolving visualization can keep up with the evolving simulation. If the scientist sees that a run is going awry, he or she can cut it short, or even adjust the code or the problem's parameters on the fly. Getting what you want to see In visualization, one of the most challenging tasks is to allow scientists to find interesting things in data. "Finding interesting things can be a difficult objective to achieve," says Bethel. "Often, scientists are not sure exactly what they mean by interesting." Worse yet, given the large number of control parameters needed to produce different types of visual results, using visualization software can be a complex task in itself. In a second major article in Computer Graphics and Applications, Bethel and Shalf team with colleagues in the Visualization and Graphics Research Group at the University of California at Davis to tackle the problem of making Grid-based visualization friendly for nonexpert users. "Web browsers are familiar interfaces for many users, but with all these widely distributed, heterogeneous machines — including the special graphics machines employed in complex visualization applications — it's hard to deploy a system that everyone can use," says Shalf. "In this article we're proposing a web-based portal which hides the complexity of launching complex, multi-component visualization tools from the user." Portals are well known in the e-commerce world, Shalf remarks, naming familiar examples like Amazon.com and E*TRADE.com. " The portal and browser combination addresses some user interface issues. The authors also describe a new kind of visualization application specially designed for the web environment, which excels at facilitating visual exploration of data. They describe a web-based visualization tool using a "spreadsheet-like" interface to present images resulting from variations in visualization parameters "designed to assist exploration by providing context for where a user is in their exploration, where they have been, and suggesting where they may go next." Visualization is one of the primary tools the Grid promises for furthering highly interactive, widely-distributed, multidisciplinary approaches to major scientific problems. But much needs to be done. The use of Grid portals is one still-evolving approach to the challenge of access to resources. To meet the challenge of data transfer, Bethel and Shalf emphasize that "dynamic environments require continuous adjustment of the data rates" — an area where the Visualization Group is hard at work on a range of network solutions "so these Grid applications don't stomp all over each other in practice," as Shalf puts it. Plenty of other challenges lie ahead in repairing what Bethel calls "the disconnect between the research community and science's practical tools." Or, as Shalf says of prospects for improving Grid-based visualization, "It's a work-rich environment." Additional information
|
||||||||||||||||||||||||||