Why is the luminal subtype so over-represented among older breast cancer patients?

Friday, September 5, 2014
Broadly speaking, there are two main lineages of cells that form the mammary gland: luminal cells, which can be thought of as secretory, and myoepithelial/basal cells which are tumor suppressive and contractile. Detailed molecular analyses of breast tumors have led to the identification of at least five “intrinsic subtypes” of breast cancers: normal-like, HER-2, Luminal A, Luminal B, and Basal-like. As their names might suggest, the luminal subtypes have a number of molecular features in common with the normal luminal lineage and basal subtypes with basal lineages, but in all cases the cells-of-origin are not clearly known at this point.
As we have been discussing, incidence of breast cancer rises with age in the US, and Jenkins and colleagues showed the majority of post-menopausal cancers are of luminal subtypes. In Garbe etal Cancer Research 2012, we showed that human mammary multipotent progenitor cells, which are one of the chief suspects in the hunt for breast cancer cells-of-origin, accumulate and acquire a luminal differentiation bias with age. Curiously, it seems that the luminal differentiation bias is somewhat tarnished because the older luminal cells possess properties of basal cells as well – indicating an inability to fully commit to the luminal lineage. We do not completely understand this yet. In order to get a handle on why this luminal bias exists and how it might relate to the process of malignant progression, I (Fanny) started tinkering with the stiffness of the matrix around the progenitor cells to see whether or not chronological age altered their ability to respond – it did (Pelissier etal Cell Reports 2014). Some of our colleagues have shown that normal breast tissue is much more compliant than tumor tissue (surfaces like glass are much stiffer than anything in the breast), and it turns out that stiffer tissue sort of enhances malignant behavior of cancer cells (here is a link to a great video primer on breast density made by Zero Breast Cancer). Normal progenitors from women in their 20s and 30s would differentiate into myoepithelial/basal cells as the matrix was stiffened to approach a physiological, albeit malignant, tissue stiffness. Post-menopausal progenitors, on the other hand, were quite unresponsive to the physiological range of stiffness, but they would make those basal-ish luminal cells when we put them on surfaces that were as stiff as glass. We made some genetic modifications in the normal progenitors to make them immortal, which is a rate-limiting step in cancer progression. This act of transformation rejuvenated the older cells’ ability to respond to physiological changes stiffness, but the immortal older cells still exhibited the same tendency to make weird luminal-like progeny on stiffer matrices, whereas the immortal younger cells still made basal-like cells. We speculate that the cells’ epigenetic states (i.e. modifications that change how the genome is expressed without changing the DNA sequence) that are associated with aging explain these differentiation biases in young and old progenitors. If we assume that the epigenetic states precede malignant transformation it would help to explain the distribution of intrinsic subtypes described by Jenkins and colleagues.
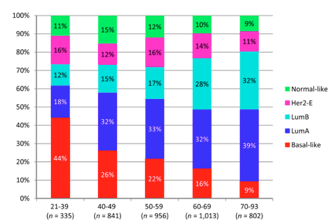
This graph is from Jenkins etal Oncologist 2014. It shows the proportion of the different intrinsic breast cancer subtypes as a function of age group. The Luminal A and B subtypes represent the vast majority in patients 50 and up.
Fanny Pelissier comments on Jenkins etal in the Oncologist 2014